


Waterford - Cork City Data Preview
July 11, 2025, League of Ireland Premier Division

It might be a bottom of the table clash, but Friday’s match between Waterford in 8th & Cork City in 10th could be an interesting one. Waterford are 7 points clear of Sligo Rovers, but in worse form. Cork City are then 5 points below Sligo (and for good reason), but have shown they can cause issues for even some of the better teams this season.
Here is a data-focused preview of the match using the last 4 games of each team, heavily inspired by the wonderful Sporteria. Sporteria create similar analysis images for Japanese matches. We’ll touch on many key areas of the matchup, from box entries to scoring/conceding times, and shot maps to inswinging/outswinging corners.
I’ll let the data speak for itself for the most part, but with some commentary for each topic. Given that this is the first time I’m posting this, I’ll explain each graph first as well.
All data is from Opta. I have of course engineered plenty of variables/metrics/context, but the raw data is Opta’s. I have used my own xG model as well, as my data does not have xG included.
Box Entries
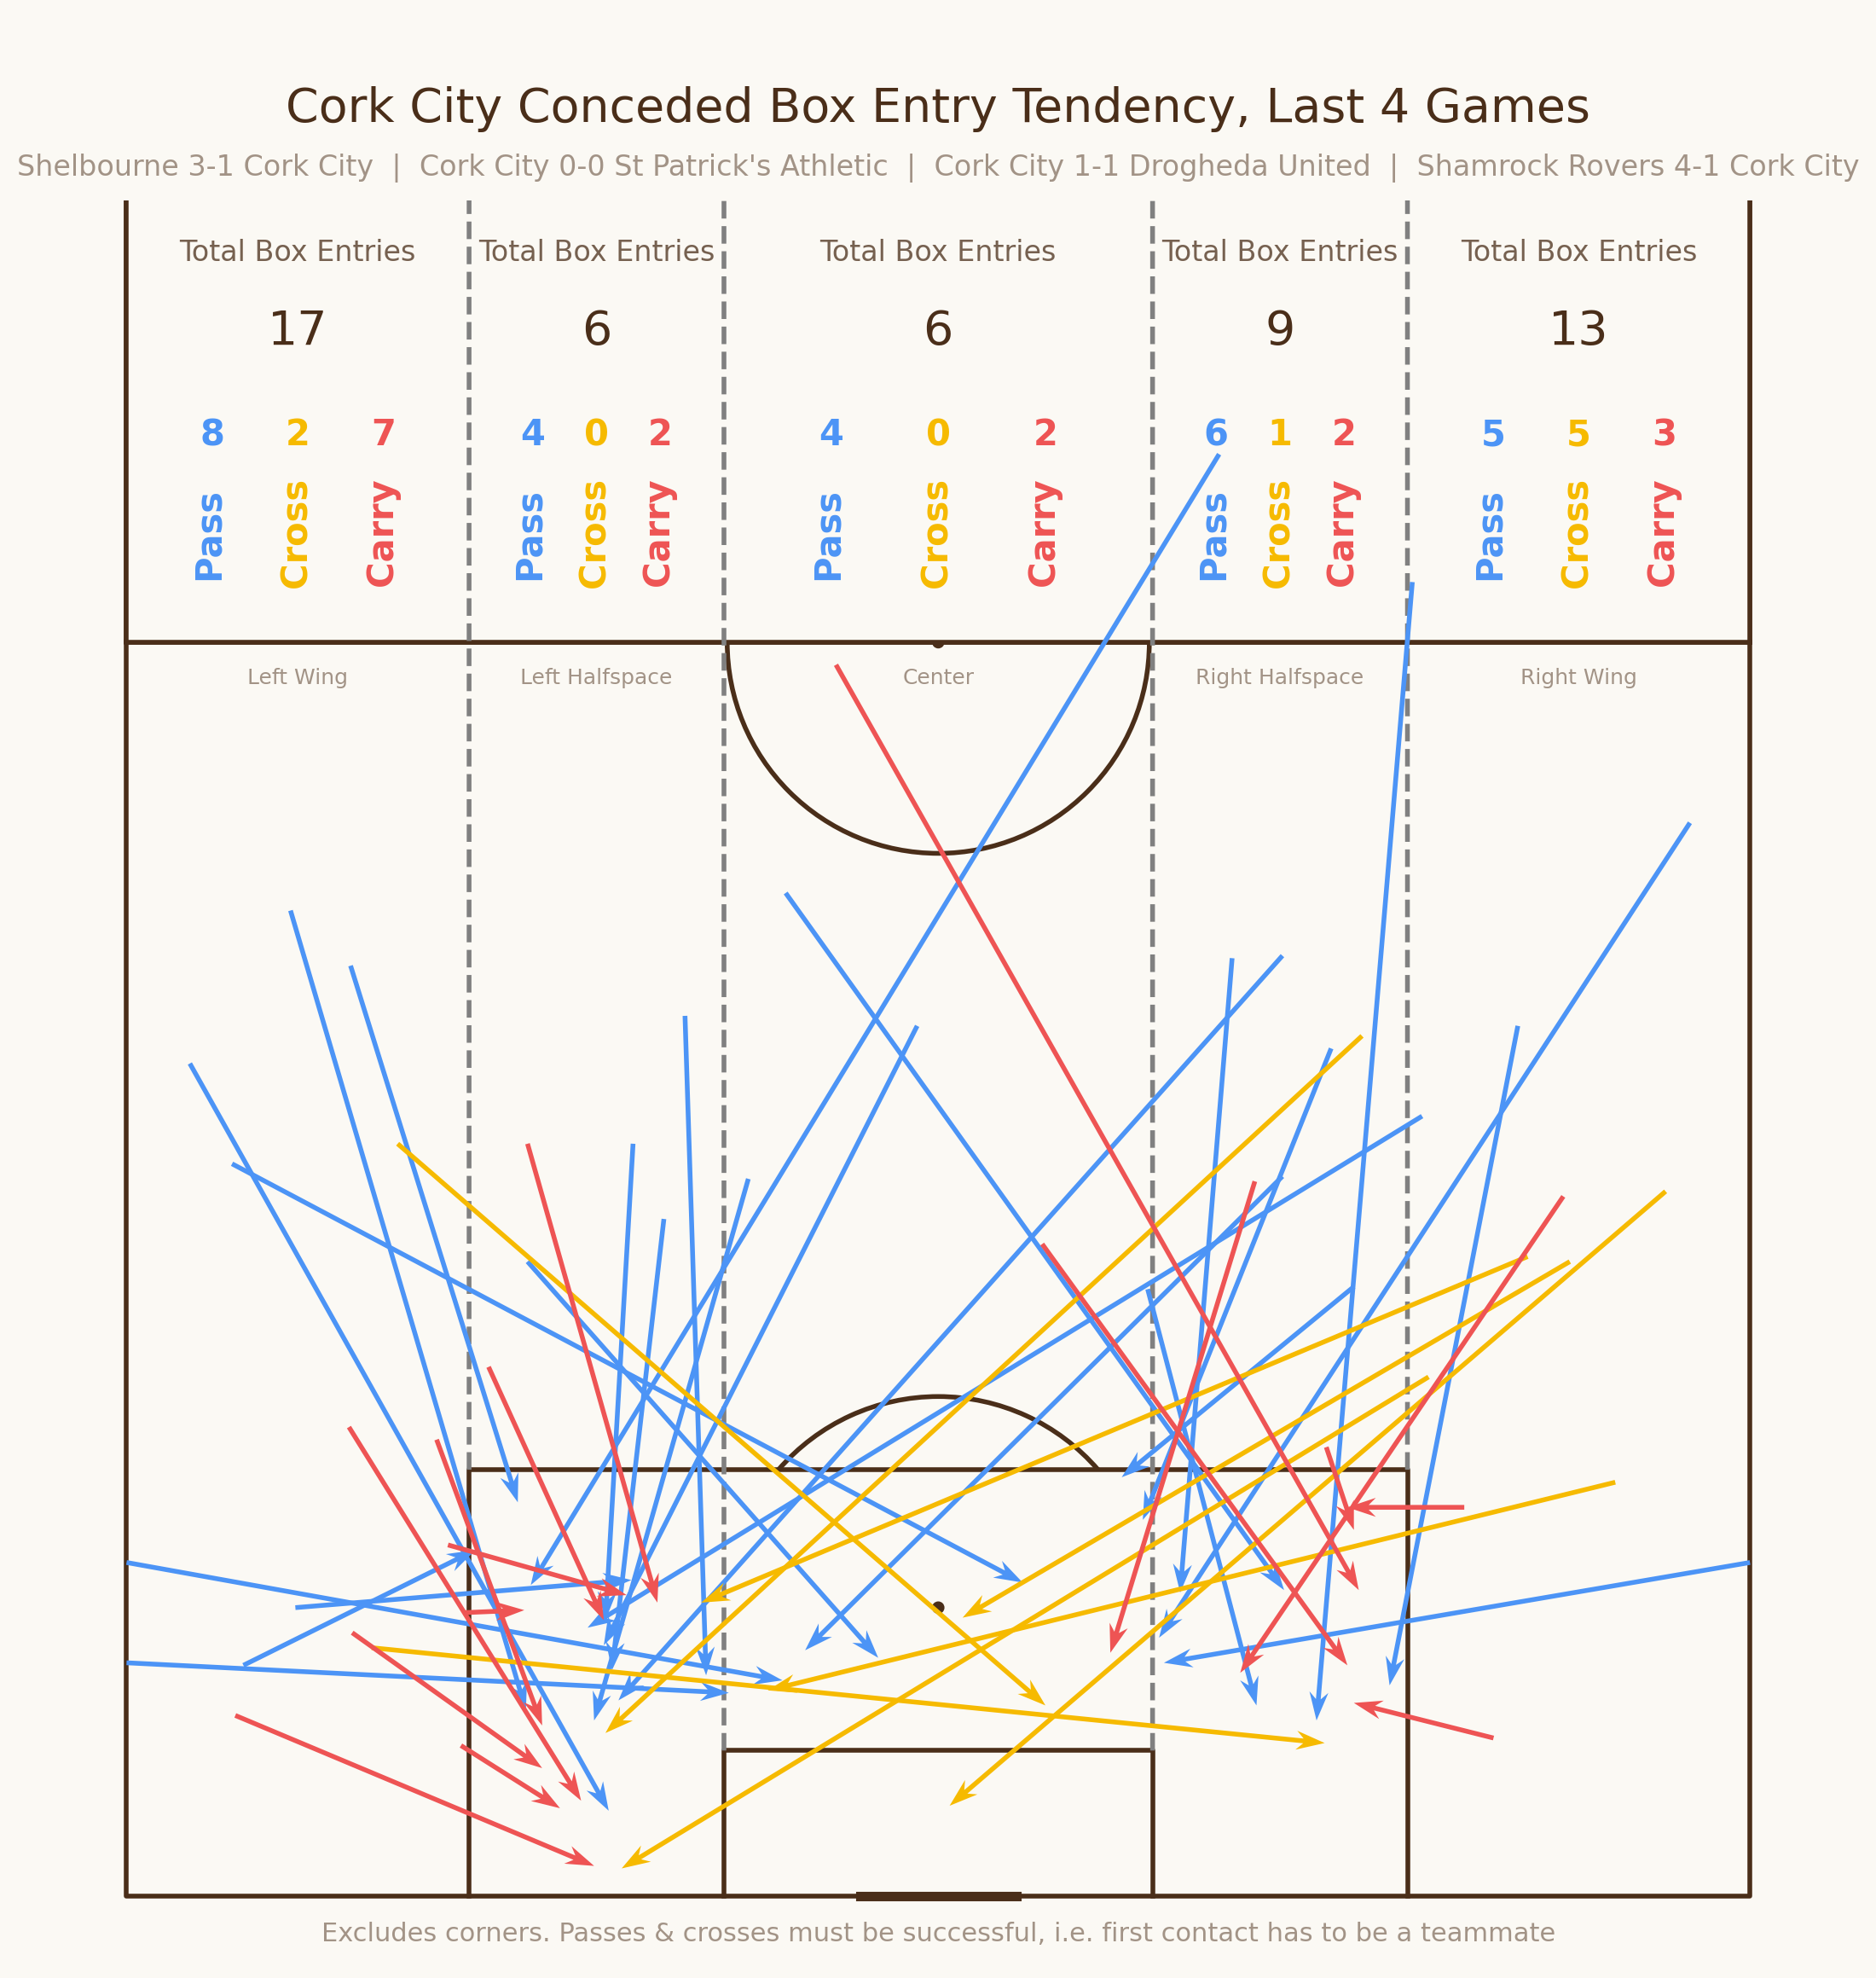
These images show a team’s box entries in their most recent games, split into Passes, Crosses, and Carries. They are also totaled by the lane in which they originated from. There is also an image for the team’s conceded box entries. These images, taken together, help us see any recent patterns in how a team is entering the box and allowing opponents into their own box.

Waterford are very wing-heavy when entering the box. 26 from the flanks, 10 from the center & half-spaces. Further, of their 7 carries into the box, 5 came from the left flank. Beyond that, 4 of Waterford’s 5 crosses came from the right flank. This shows an asymmetrical element to Waterford’s attacking game.
Cork City will of course have to defend the center of the pitch, but they’d do well to be mindful of the different uses of Waterford’s flanks

Defensively, Waterford are very open. They have conceded the most goals this season (42, just one more than opponents Cork City). There has also been an asymmetrical nature to their conceded box entries, similar to them going forward.
Waterford’s left flank in defense is very open, much more than their right. 10 of the 13 crosses they’ve conceded into their box came from their left. Relative to their total entries conceded, Waterford are much more prone to carries into their box from the right than left. Waterford are also prone to conceding vertical balls into the box, not just crosses or diagonals.
Cork City could use this to their advantage, although they may have preferred Waterford’s left flank to be more open to carries given Milan Mbeng’s performances this season.

Cork City are also a little asymmetrical, but really only with their crosses. They tend to enter the box from crosses much more regularly from the left than right flank, but are fairly balanced overall.
Waterford’s left flank was the most prone to crosses, so it doesn’t line up perfectly with Cork City’s strength. This could be an area to watch, to see if Waterford can shut down Cork City’s left-flank crosses.
Cork City, naturally, are also quite open defensively. Similar to Waterford as well, they are lopsided at conceding crosses into their box. 6 of the 8 crosses they’ve conceded in the last 4 games have come from the right flank or half-space, only 2 from the left. However, these crosses are typically from in front of the box, and Waterford have preferred to play crosses from the side of the box. Cork City might be able to stop Waterford from getting into their favored position here.
Shot Assist Locations
Similar to the passes into the box for & against, these images show the shot assists a team has made over the last 4 games, and the shot assists they’ve conceded.
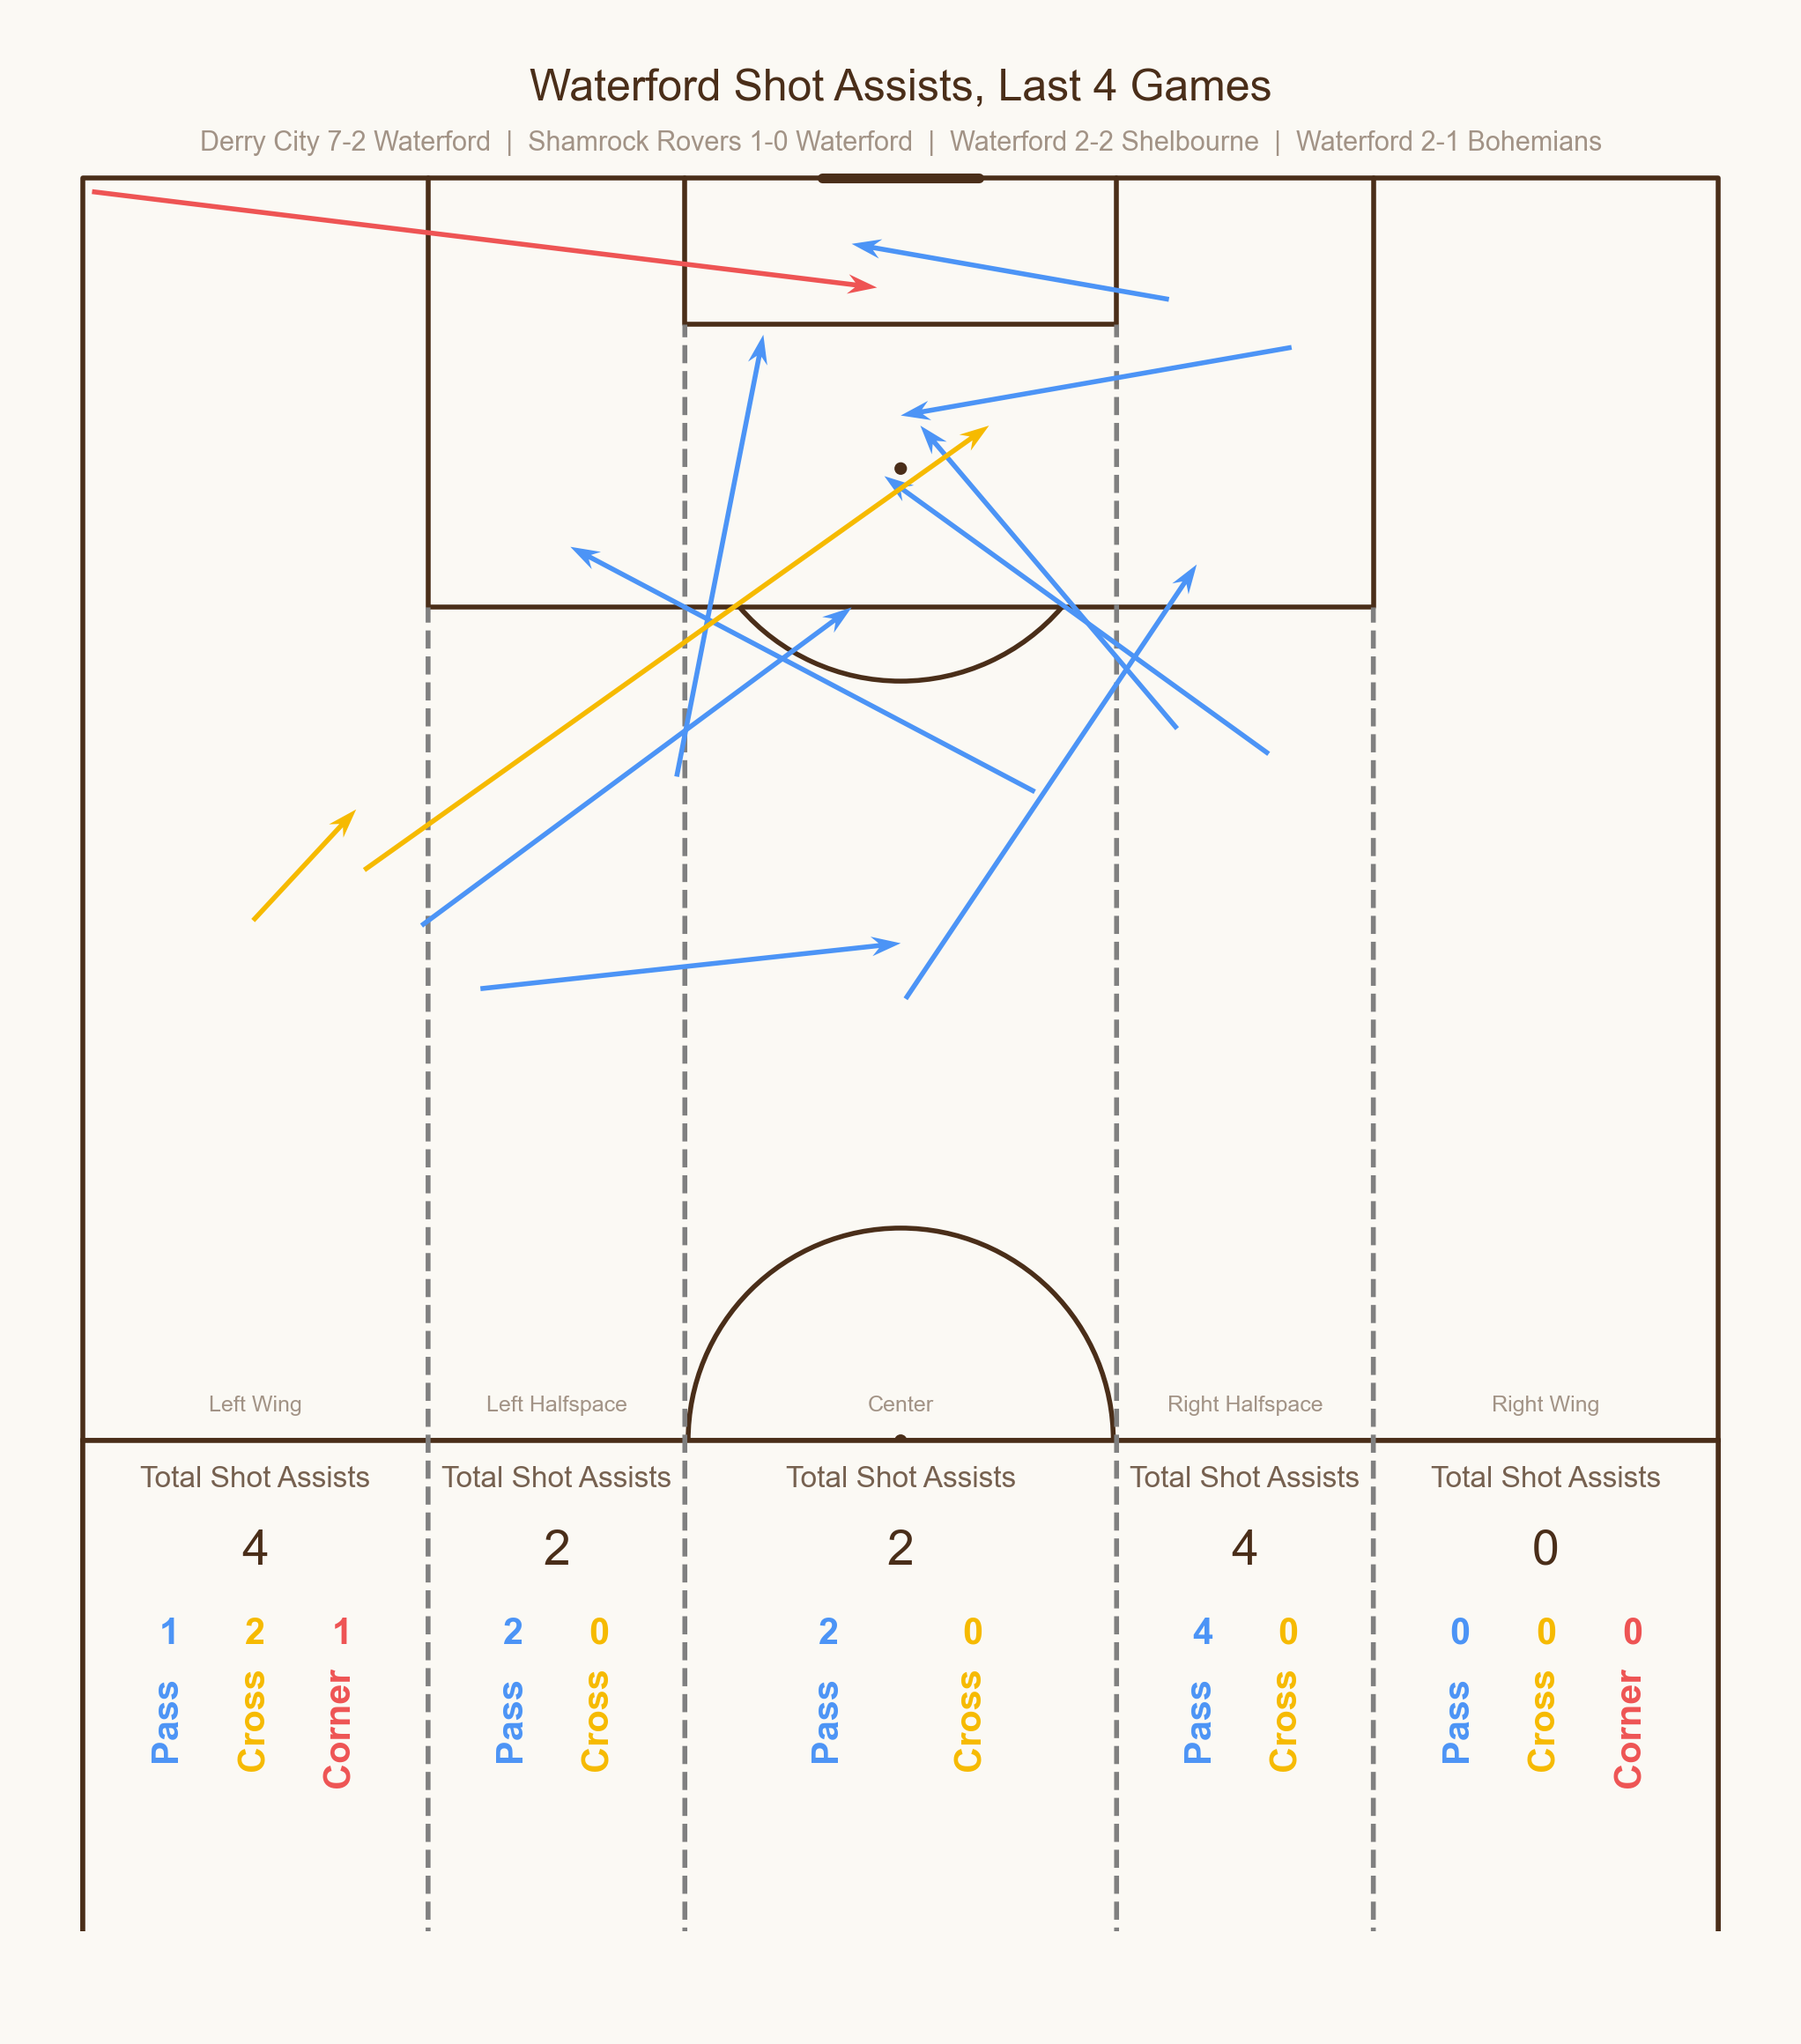

Waterford are, of course, very open at the back. While they have conceded a lot of box entries from the flanks, most of the open-play shots that they’ve conceded have been assisted from more central areas.

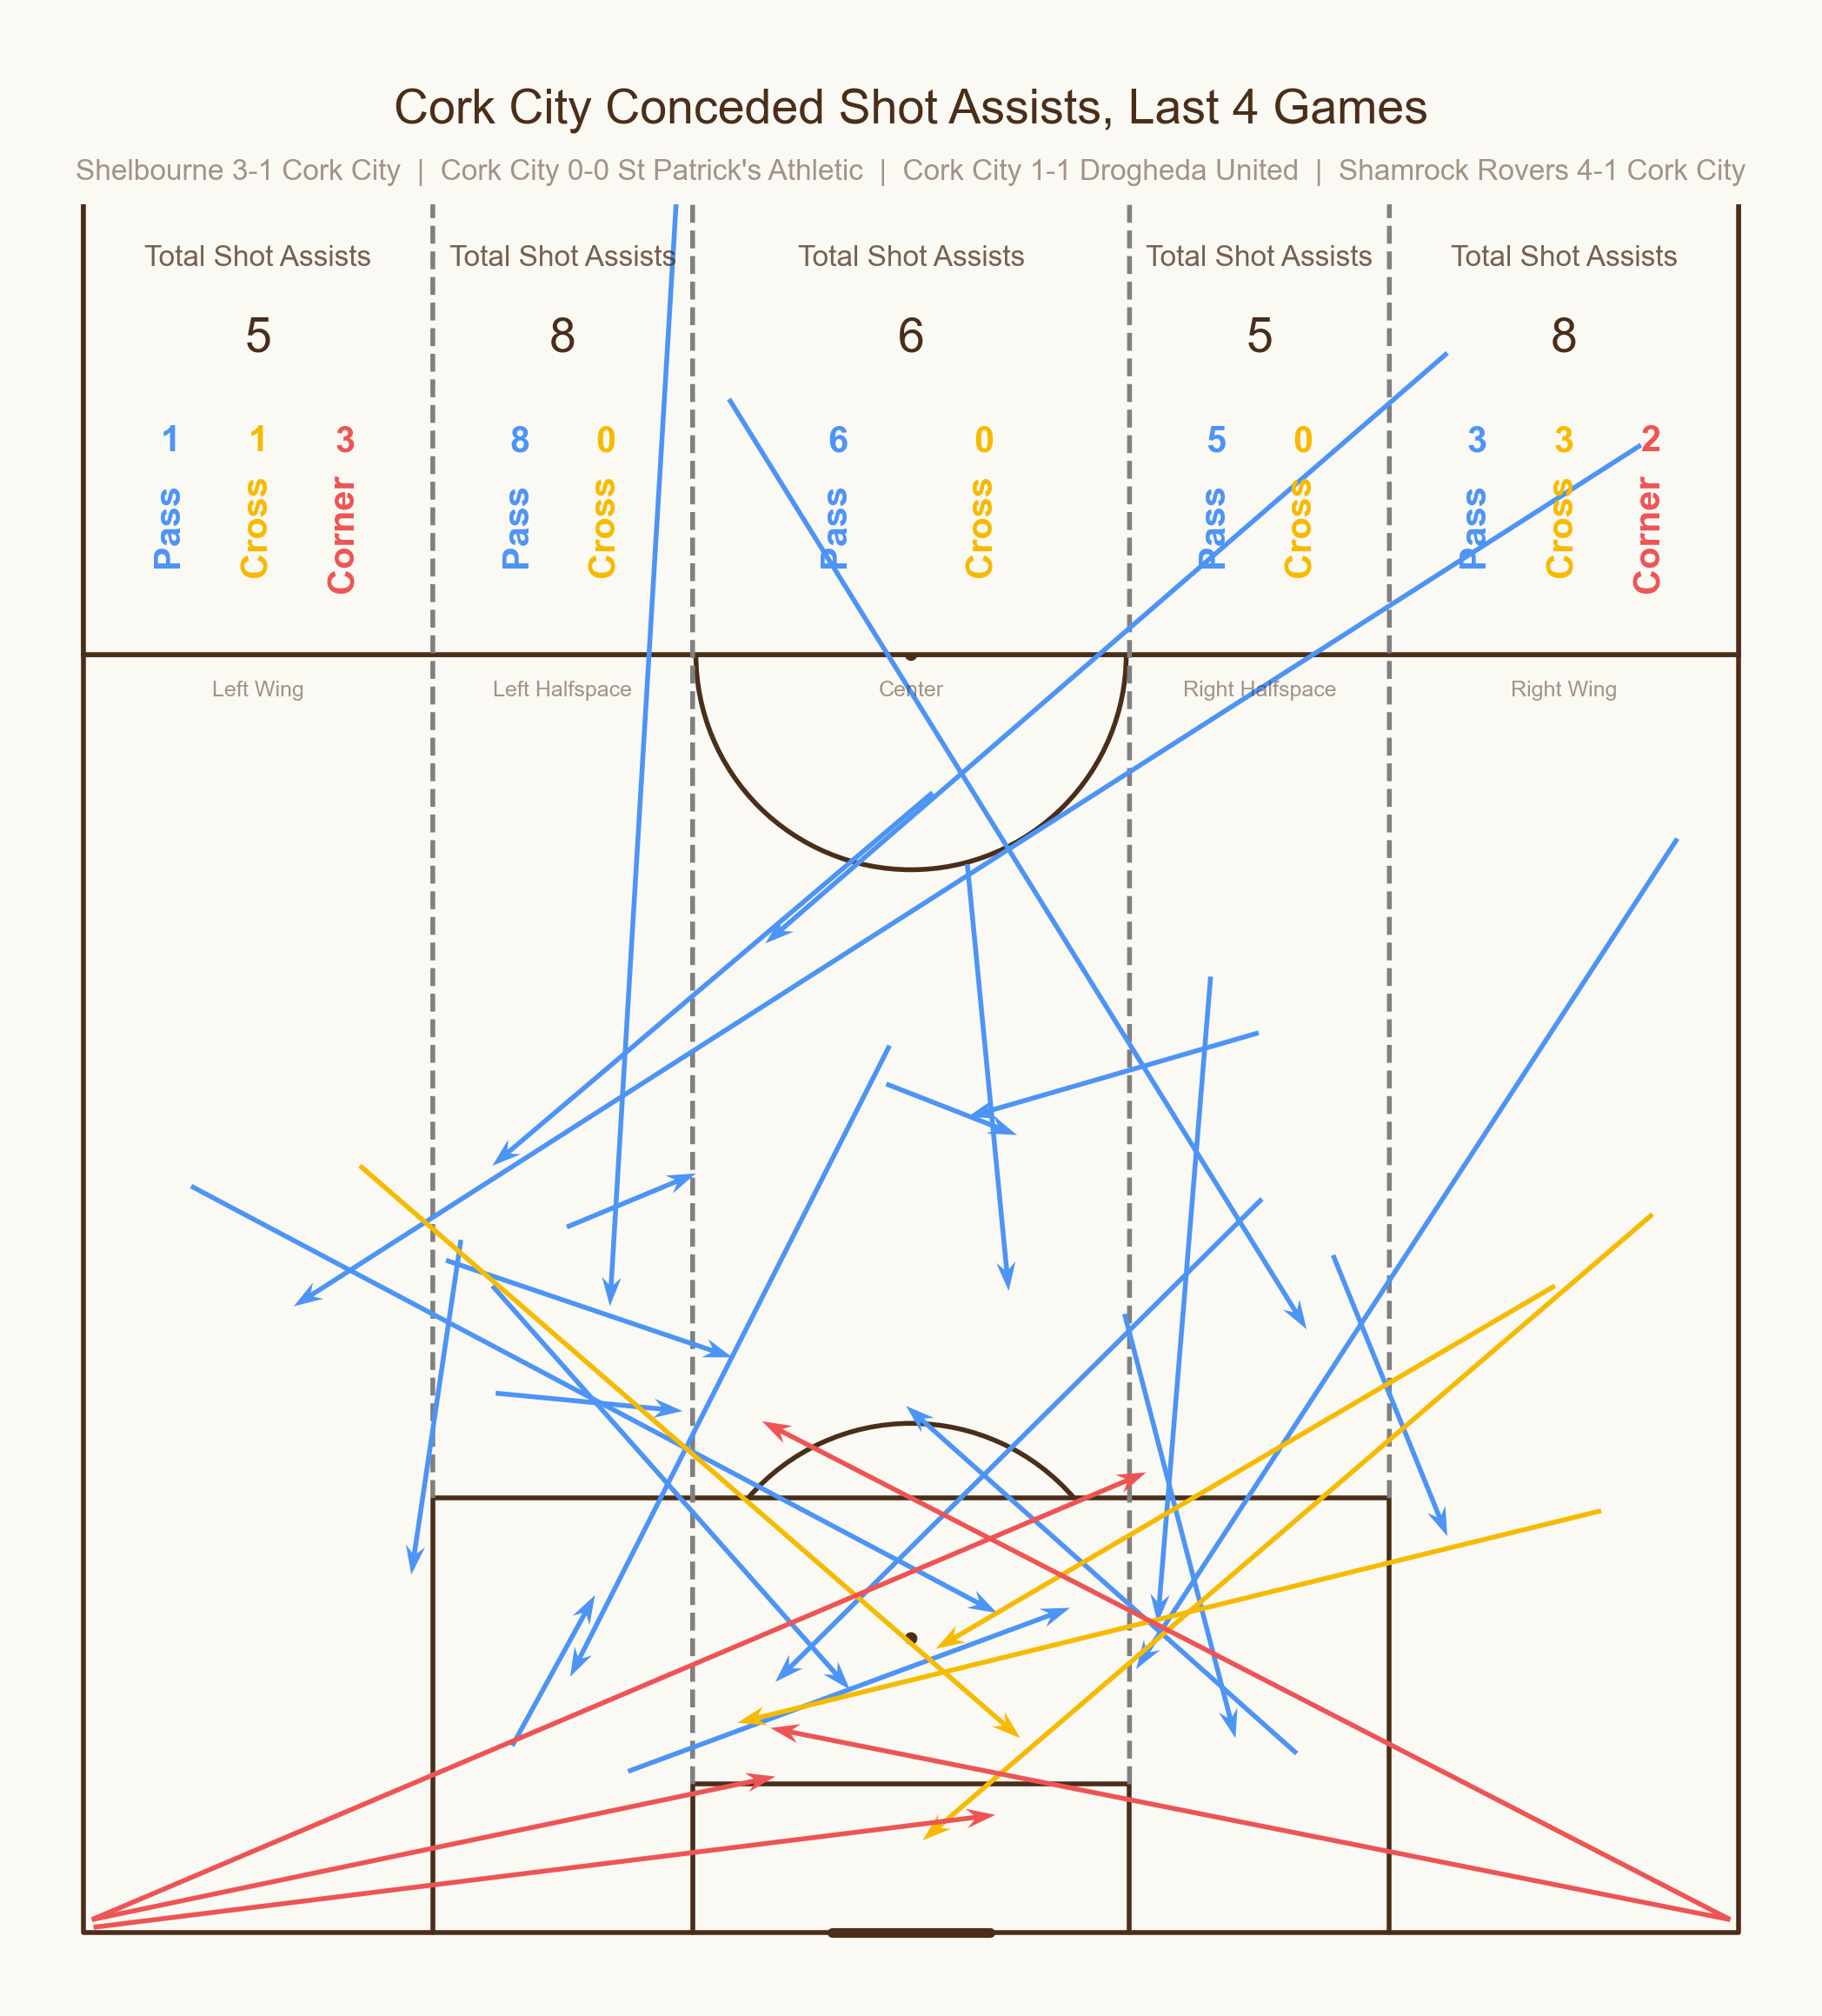
Comparing that to Cork City’s shot assists made we find that Cork City might have some advantage here. They’ve been able to generate a fair few shots recently, with many coming from central area passes (and of course, crosses from their left). Could this be a key area for Cork City? If they get the ball around Zone 14 (the central space in front of the box) they might be able to capitalize. But then again, that’s been an issue for City this season.
Scoring & Conceding Patterns
These images show, from the viewpoint of one team, the play patterns that they score from stacked against their opponents’ concessions in that same pattern. The right side of the image shows the focal team’s concessions compared to their opponent’s goals scored. These do not add up to their total goals scored/conceded because you could have a short pass in a fast break, which would count towards both of those categories.
As I post more of these data previews we’ll see how most goals are tagged as “unassisted” by Opta.
Waterford have only scored 2 goals from short passes this season, while Cork City have conceded 6. This, as well as corners and crosses with similar numbers, could be an interesting thing to watch for in the game. Could Cork City’s relatively weak defending on these types of passes lead to Waterford scoring, or will Waterford not be able to take advantage since they are poor at scoring from these areas?
On the flip side, Waterford have conceded 4 penalties and Cork City have scored 4 penalties so far this season. That is quite the matchup, as on the other side, Waterford have scored just 1 while Cork City have conceded just 1. If we’re to see a penalty in this game, chances are it’s Cork City scoring it! Other key matchups are corners and crosses. The numbers don’t look great for Waterford here.
Cork City’s image is effectively the same as Waterford’s, but with their goals scored/conceded colored. We’ve already touched on the main areas to watch out for.
The image below shows similar goals for/against from the focal point of one team, but by the time in which goals tend to happen. The numbers shown are how many goals are scored or conceded in that time bucket. So a 0.26 in the 0-15 bucket would mean that team scores/concedes 0.26 goals in the first 15 minutes, on average.

We can see that Waterford’s data is fairly balanced in terms of when they score, although they seem to be sluggish in the middle period of each half. Cork City are also quite balanced at conceding, but tend to concede more at the end of the game, 0.48 goals per game after minute 75.
This tells me that we could see Waterford score any time, but likely at the beginning and end of each half.
On the other side, the probability that Cork City scores will likely increase as the game goes on. They are relatively balanced at scoring across a game, although they have yet to score between minute 16 and 30. They do start increasing their goals per game in later minutes though. Waterford are also somewhat balanced at conceding but increase their concessions in the second half, especially in the final 15 minutes of the game. This could be when we see Cork City pick up a point or 2.
Both teams, funnily enough, have conceded 0.48 goals on average in the final 15 minutes of their games… it almost feels like we’ll be guaranteed a late goal here!
Top Scoring Threats
This image shows us the top scoring threats for each team, just so we have an idea of who to watch out for. The left side shows the team’s leading threats for the season (sorted first by goals, then xG, then shots). The right side only includes that last 4 games.

Waterford are fairly reliant on Pádraig Amond (who scored 2 in Waterford’s 7-2 loss to Derry City last time out), while Cork City don’t have a main outlet for goals. City’s 3 goals in their last 4 games have each been scored by a different player.
Shot Maps & Goalmouth View
These images show the non-penalty shots that a team has taken or conceded in the last 4 games. The bottom part of the shot map is the running sum of xG and goals scored, to see hot/cold streaks. The shot map has key info such as shots, xG (total and per 90 minutes), conversion rates, and also on the right side, a breakdown by body part.
Below the shotmap we can see where the shots on target were aimed, to see if there’s any patterns.


Waterford have scored 5 goals recently from just under 5 xG. About half of their shots are on target, and a majority are right foot shots. Most are aimed at the center of the goal.


Waterford have also conceded as many goals as expected, but a key caveat is that up until this recent 7-2 thrashing by Derry, they were out-performing their xGA. So it is possible that Cork City would need to rack up a fair bit of xG to score against Waterford.
However, we can see that most of the goals Waterford have conceded (and a majority of shots faced) have been to the keeper’s left-hand side. This is something Cork City should be aware of.
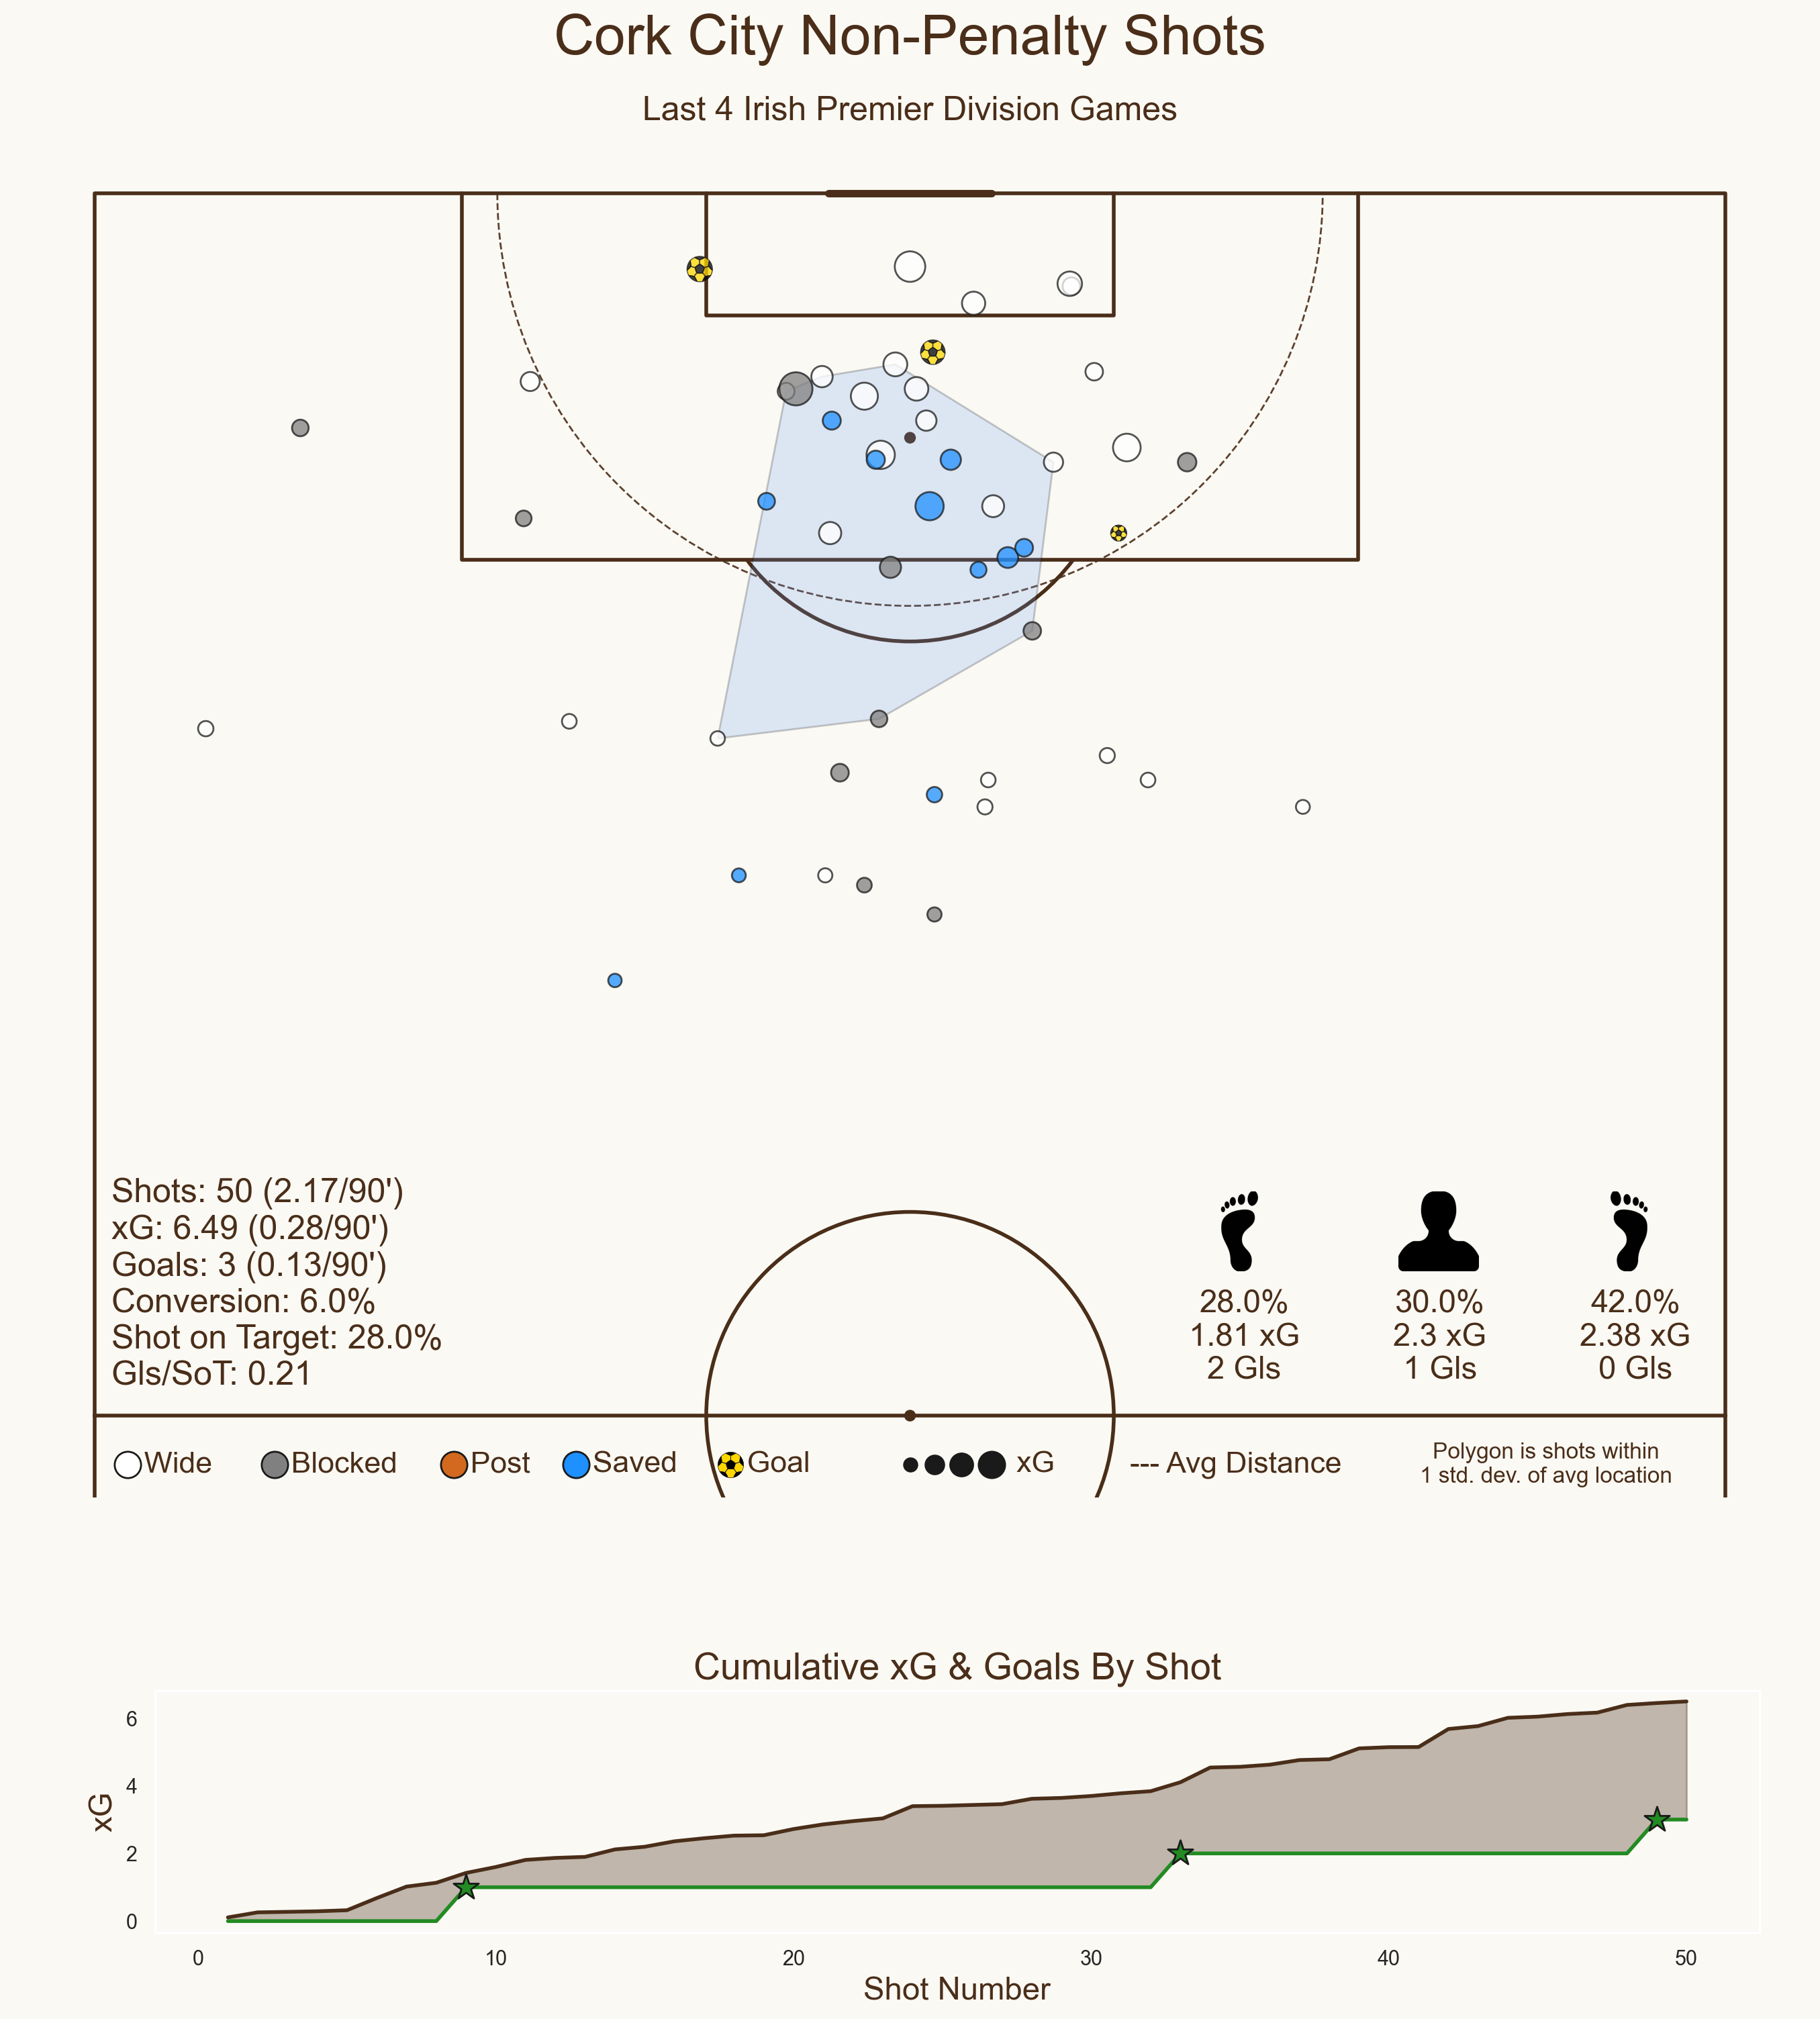
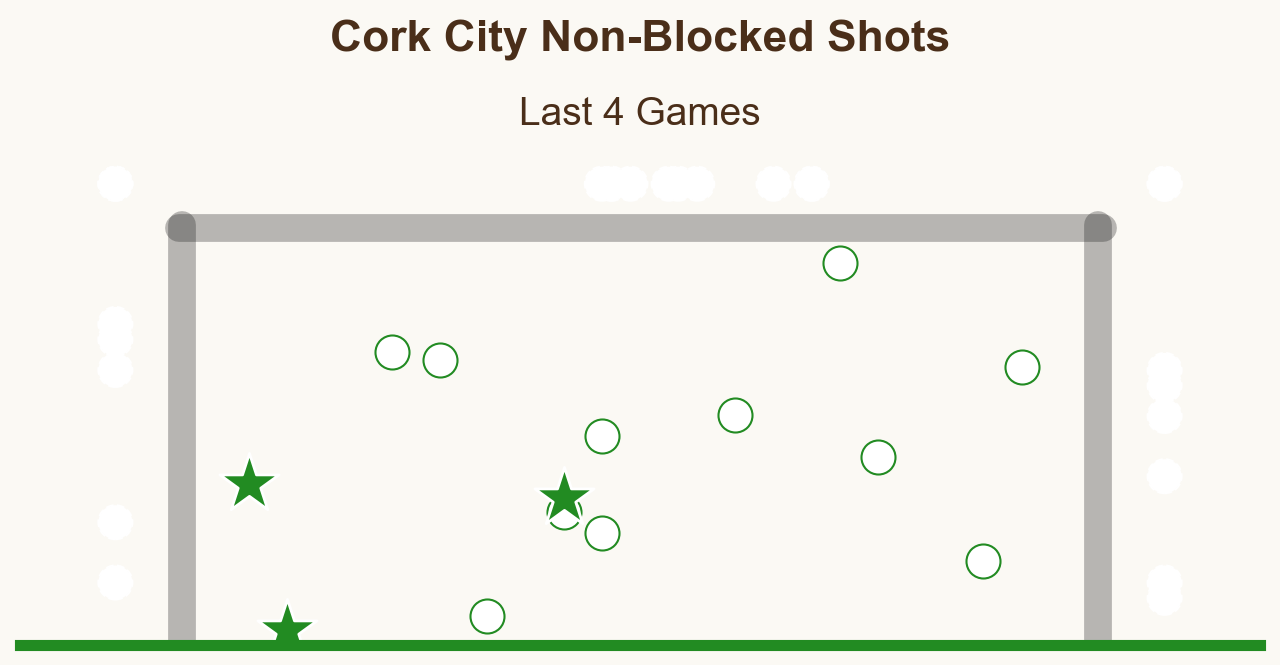
Cork City have been seriously underperforming their xG recently. This is in no small part due to their very low shot on target ratio of 28%. They’ve shot everywhere on the goal frame, but none of their 3 goals recently have been to the goalkeeper’s left.


Defensively, Cork City have under-performed their xGA as well. 8 goals from 5 xG. They’ve held opponents to a 39% shot on target rate but they concede about half of the shots on target they face. That’s a good matchup for Waterford, as they have a fairly high shot on target rate. If Waterford can get a few shots off, they may be able to put the game to bed.
Corners
These images are not heavy on analysis, but give some insight into not just where teams aim their corners, but also if they use inswingers or outswingers on specific sides.

Waterford seem to prefer inswingers, but will use outswingers on the left at times, They’ve taken relatively few outswingers on the right. Inswingers tend to be put near the goalkeeper, but outswingers further back in the box (naturally, given the spin on the balls).

Cork City are pretty similar, in terms of inswingers/outswingers. However, a lot of their inswinging right corners are aimed at the near post, but they aim corners from the left near the far post. Waterford will likely catch this in their opposition report, so they’ll have to ensure to keep someone on the back post if Cork City have a corner on the left to avoid any issues.
Conclusion
Overall, I think there’s some key elements in both teams’ recent data that bodes well for them, as well as gives the opponent something to consider. If Cork City were better finishers, I’d think that they would be able to come out on top. City might be the better side going forward right now, with similar defensive woes as Waterford. While their box entry strength is on the opposite flank as Waterford’s box entry weakness, they are able to get forward relatively consistently and that could be an issue for Waterford.
If Cork City are still in the game with 20 minutes left, I could see them winning it. However, City have been poor in front of goal this season so they’ll need to have much more of a quantity over quality approach than normal.