Creating an xS Model for Australian Rules Football

This article takes a slight detour from my usual soccer data pieces. But don’t worry, we’re still in a code of football… Just one down under. Australian Rules Football is probably my 2nd favorite sport, and I’ve slowly been playing with more AFL data over the past year and a half (and even made a Streamlit app Footy Radars as well).
I’ve been able to get Champion Data event data with the help of some friends in the AFL data community and I’m finally at a place where I’m comfortable understanding, engineering/manipulating, and visualizing the data. So, I decided to tackle my first of two big projects, Expected Score (the other, VAEP, is coming together nicely but not finalized yet).
Expected Score (xS), is, for my soccer readers, the footy version of xG. xS is not new in footy, not at all! One of the best AFL data websites by Andrew Whelan, Wheelo Ratings, has lots of xS data. There’s even a Twitter bot by TheAFLLab that posts live xS updates for every game. It’s not new, but I wanted to build my own model because:
1) I don’t have access to xS in my raw data, and
2) I love coding
The Data
I scraped the past 4 completed AFL seasons, 2021 through 2024 for all event data. This data contains most actions in a match, such as kicks, handballs, marks, ball gets, spoils, frees for, and center bounces. Variables such as the x/y coordinates, period, venue, the direction the home team attacked in the first quarter, time, team, and player are all tagged as well. Disposals (kicks & handballs) have effectiveness info (effective, ineffective, or clanger) and kicks deemed to be an attempt at goal are flagged. Scoring shots are tagged as a goal or behind, and those that are behinds tell us if it was a left or right miss or hit the left or right post.
On top of that, since the data is sequential and time-stamped, I engineered information for each shot:
1) The end of the ground the player is shooting at
2) Distance to the goal
3) Angle to the goal
4) The elapsed time from the prior event (in seconds)
5) If the shot follows a mark
6) If the shot follows a Free, and
7) If the shot follows a handball being received
These last four variables are crucial, because a kick taken after either a mark or a free will usually allow the player to collect themselves, slow their heartrate and breathing, aim, and kick under no pressure. Shots taken in the natural flow of the game are very different. Estimating context with the prior event and time taken before kicking should add some richness to the model, allowing it to be more accurate. Sadly, I don’t have any way of estimating the type of shot (drop, banana, etc) or the foot the shot was taken with. I also don’t have weather information in the data set and don’t want to deal with scraping past weather data based on venue, date, and kickoff time… maybe this is the first step for my xS 2.0?
A big miss in my data is the amount of pressure a player was under when kicking. The data isn’t granular enough to engineer something to proxy pressure either. This is partially why I decided to add info if the shot follows a mark, free, handball, and the time elapsed before kicking.
Finally, I add in how many points each shot scored: 0, 1 for a behind, and 6 for a goal.
Sample Size
Overall, from 4 seasons of data, I have 41,678 shots in my sample. This should be a pretty healthy sample size to work with even without some key info like type of kick, footedness, and pressure.
The Method
I used the XGBoost package’s XGBRegressor because I found that using a multinomial logistic regression model was a bit worse. For those of you who are soccer fans and have never heard of AFL… instead of the xS telling us roughly the chances of a kick going between the goal posts (or the behind posts), we can interpret xS as the rough number of points a specific shot should theoretically score.
I passed 10 features to my model:
1) X
2) Y
3) Distance to goal
4) Angle to goal
5) Elapsed time before kick
6) If shot follows a mark
7) If the shot follows a free
8) If the shot follows a handball being received
9) Venue
10) End of the ground being shot at
11) If the player is a home or away player
The target variable, naturally, is the number of points scored.
The Results
The RMSE for this model is 2.47, compared to 3.24 for the multinominal logistic model. Further, taking all of the games played over the past 4 seasons, 85.1% of the time the team with the higher total xS wins the game, compared to 80.1% with the multinominal logistic model.
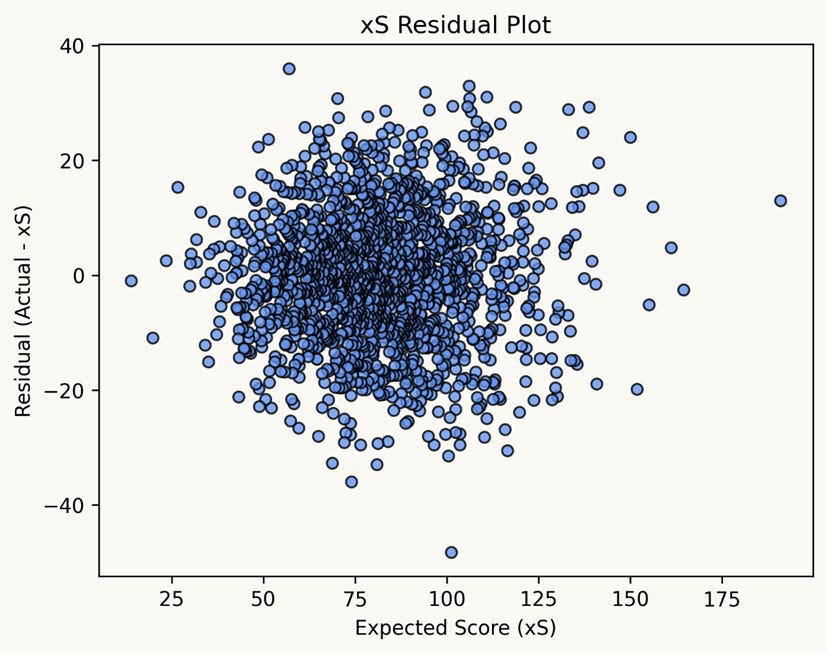
There is an 88.2% correlation between xS and actual score across these games (the point on top being Sydney’s 205-34 win over West Coast in 2023).
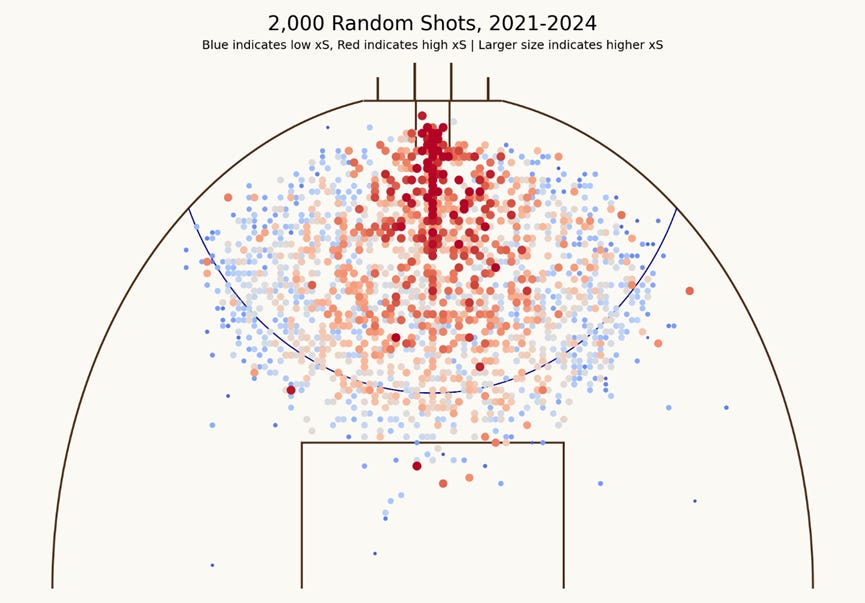
And below we can see that, naturally, shots closer to the goal tend to have a higher xS, as do shots from less of an angle. This isn’t new news, but it’s just another piece of info to back of the model’s validity.
Overall, I’m quite comfortable with this model and am happy with the results. For a little fun, here are some tidbits from the last 4 seasons:
Highest xS: Sydney Swans had an xS of 191.0 vs West Coast on June 24, 2023
Lowest xS: West Coast had an xS of 14.0 vs Carlton on August 18, 2024
Highest xS without winning: Bulldogs had an xS of 110.2 but lost 84-97 to Essendon on August 8, 2021
Player Performances – 2021 to 2024
This data has been used to train the model, but we’ll get to 2025 data in a minute. I just want to show some of the top kickers according to xS in this dataset first.
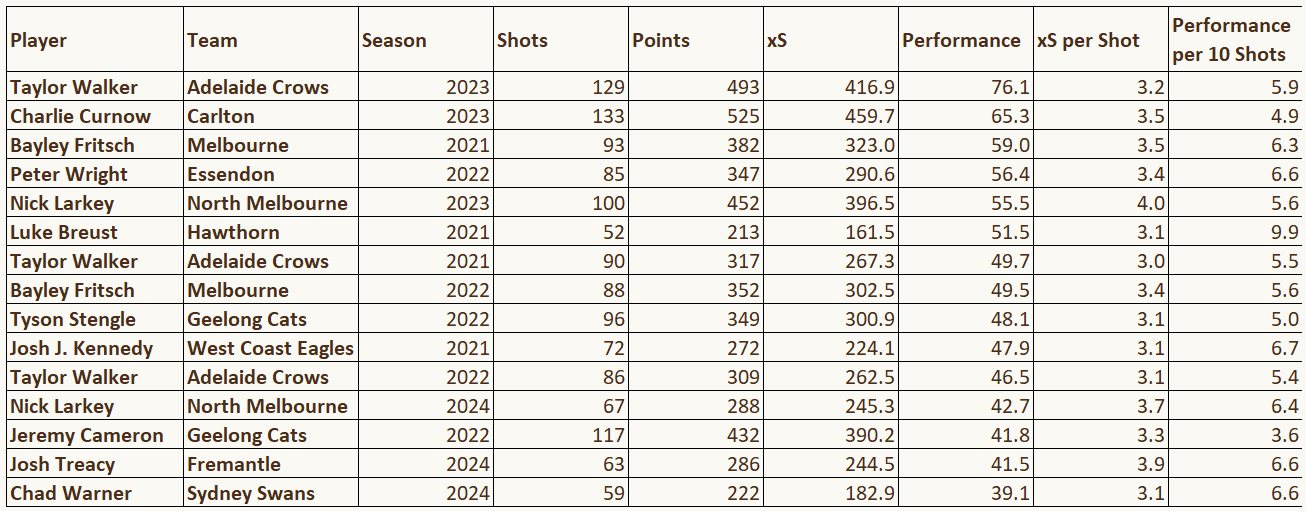
Top 15 Players, by Season, by xS
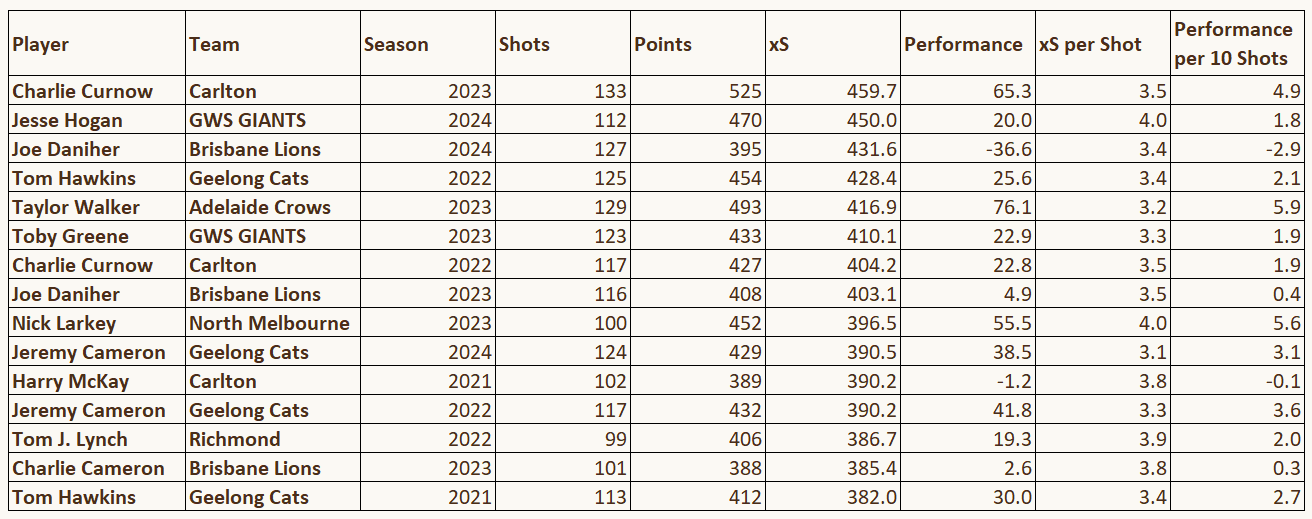
Charlie Curnow’s 459.7 xS in 2023 is the highest xS in a single season over the past 4 years. Jesse Hogan last season came close with 450.0, with Joe Daniher last season rounding out the top 3. Curnow also over-performed his xS in 2023 by 65 points. Naturally, he won the Coleman Medal and was an All-Australian.
Top 15 Over-Performers
Taylor Walker scored 76.1 more points than expected in 2023, the biggest over-performance of the last 4 years. Tex’s 2021 and 2022 seasons also feature in the top 15 highlighting his scoring ability.
Top 15 Under-Performers
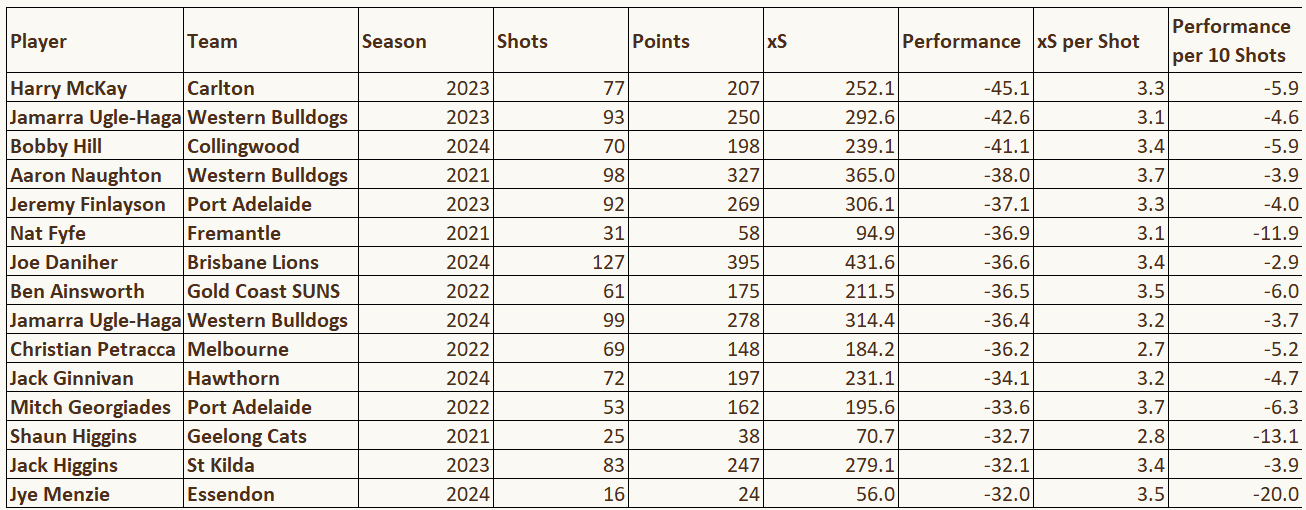
Harry McKay wins the wooden spoon for performance vs xS after a 2023 season where he scored 45.1 fewer points than expected.
2025 Results
Here are some results from the current season, as of time of writing (July 29, 2025 – after Round 19).
Top 10 Players by xS
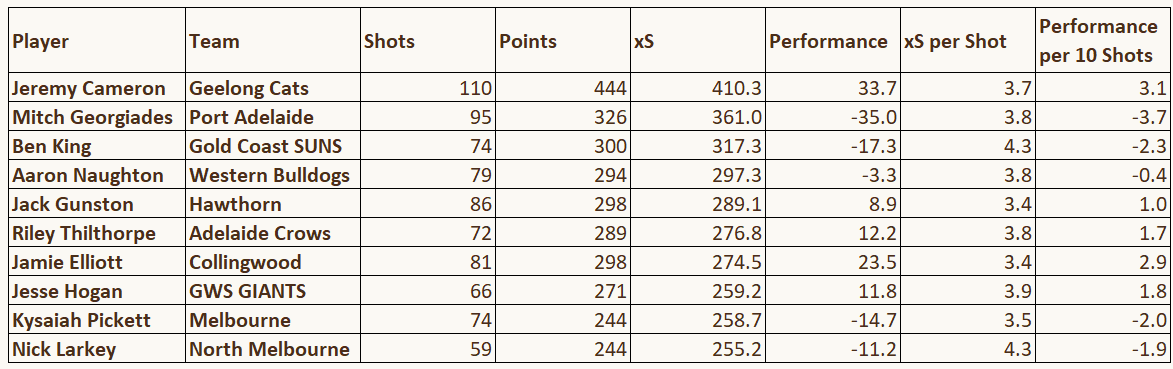
Jeremy Cameron has both scored the most points so far and generated the most xS… by a mile! His 410.3 xS is nearly 14% greater than Mitch Georgiades in 2nd place with 361.0. All that practice on the farm has paid off for Jezza time and time again.
Top 5 & Bottom 5 Players vs xS, Per Shot (minimum 38 shots)
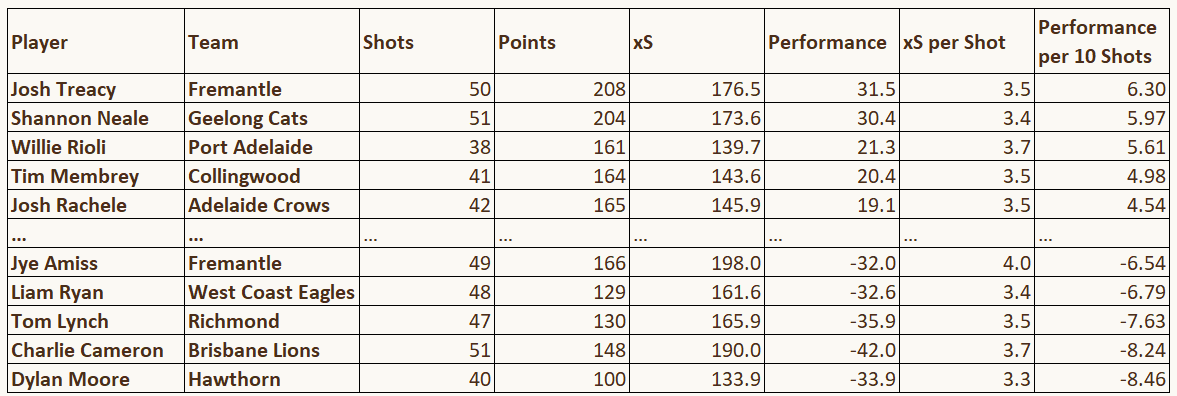
With a filter of 38 shots minimum (not scientific, just 19 rounds times 2), Josh Treacy might be the best finisher so far. He’s scored 6.3 more points than expected for every 10 shots he’s taken. On the other side of that coin is Dylan Moore, scoring 8.46 fewer points than expected for every 10 shots. This is one of his worse seasons in terms of goal accuracy, with the AFL having him at 37.2%. Further, this is the only season in my timeframe that he’s under-performing xS – so this might just be a one-off poorer season from him.
Conclusion and Improvements
As I said, I’m very happy with my xS model at the moment. I feel as though it’s pretty powerful and meets my (admittedly non-expert) eye test. There are some limitations, of course, such as not having pressure data, foot, weather, type of kick, and more. I’m sure clubs have more advanced data and models but as a fanalyst these aren’t model-breaking.
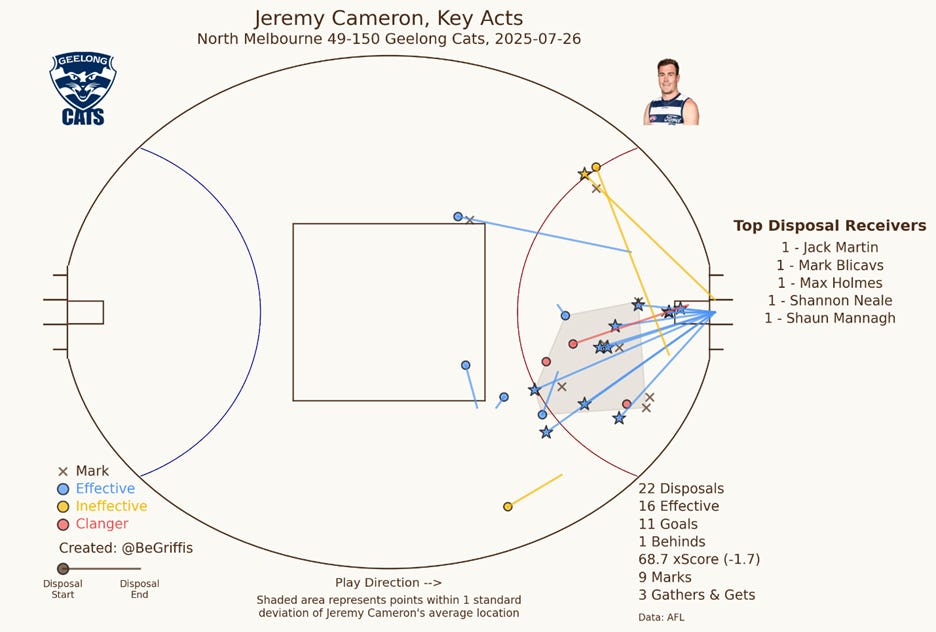
Now that I have this model, feel free to follow me on Twitter or BlueSky as I’ll be developing some fun ways to visualize this data. For a teaser, here’s Jeremy Cameron’s performance vs North Melbourne a few days ago – his 68.7 xS ranks as the highest xS game this season.